
Gays are hot
experiments in vibe-coding

Abstract
The geographic distribution of sexual minorities reflects patterns of urbanisation, social tolerance, and economic opportunity. We combine gridded mean annual surface air temperature from the UK Met Office HadUK-Grid 30-year climatology (1991–2020) with Local Authority District (LAD)-level sexual orientation counts from the 2021 England and Wales Census to test whether lesbian, gay, and bisexual (LGB) individuals inhabit systematically warmer locations than their heterosexual peers. Across 311 matched LADs, the population-weighted mean annual temperature is 10.45°C for LGB residents compared with 10.33°C for straight/heterosexual residents—a difference of +0.12°C. This thermal differential reflects the well-documented concentration of LGB populations in major urban centres, particularly London, rather than any direct causal mechanism. Because the gridded temperature product does not resolve the urban heat island effect at its 5 km spatial resolution, our estimate constitutes a lower bound on the true population-weighted temperature differential.
Introduction
Sexual minorities are not uniformly distributed across geographic space. In the United Kingdom, as in comparable economies, LGB individuals are disproportionately concentrated in large cities, drawn by economic opportunity, social anonymity, and the density of community infrastructure (1, 2). The geography of climate across the UK is similarly structured: mean annual temperatures decrease with latitude and elevation, and increase with proximity to the Atlantic and to urban centres (3). Whether these two spatial gradients—of sexual minority concentration and of temperature—overlap sufficiently to produce a detectable aggregate thermal signature has not previously been examined. Here we quantify this effect using publicly available census and climate data at LAD resolution for England and Wales.
Results
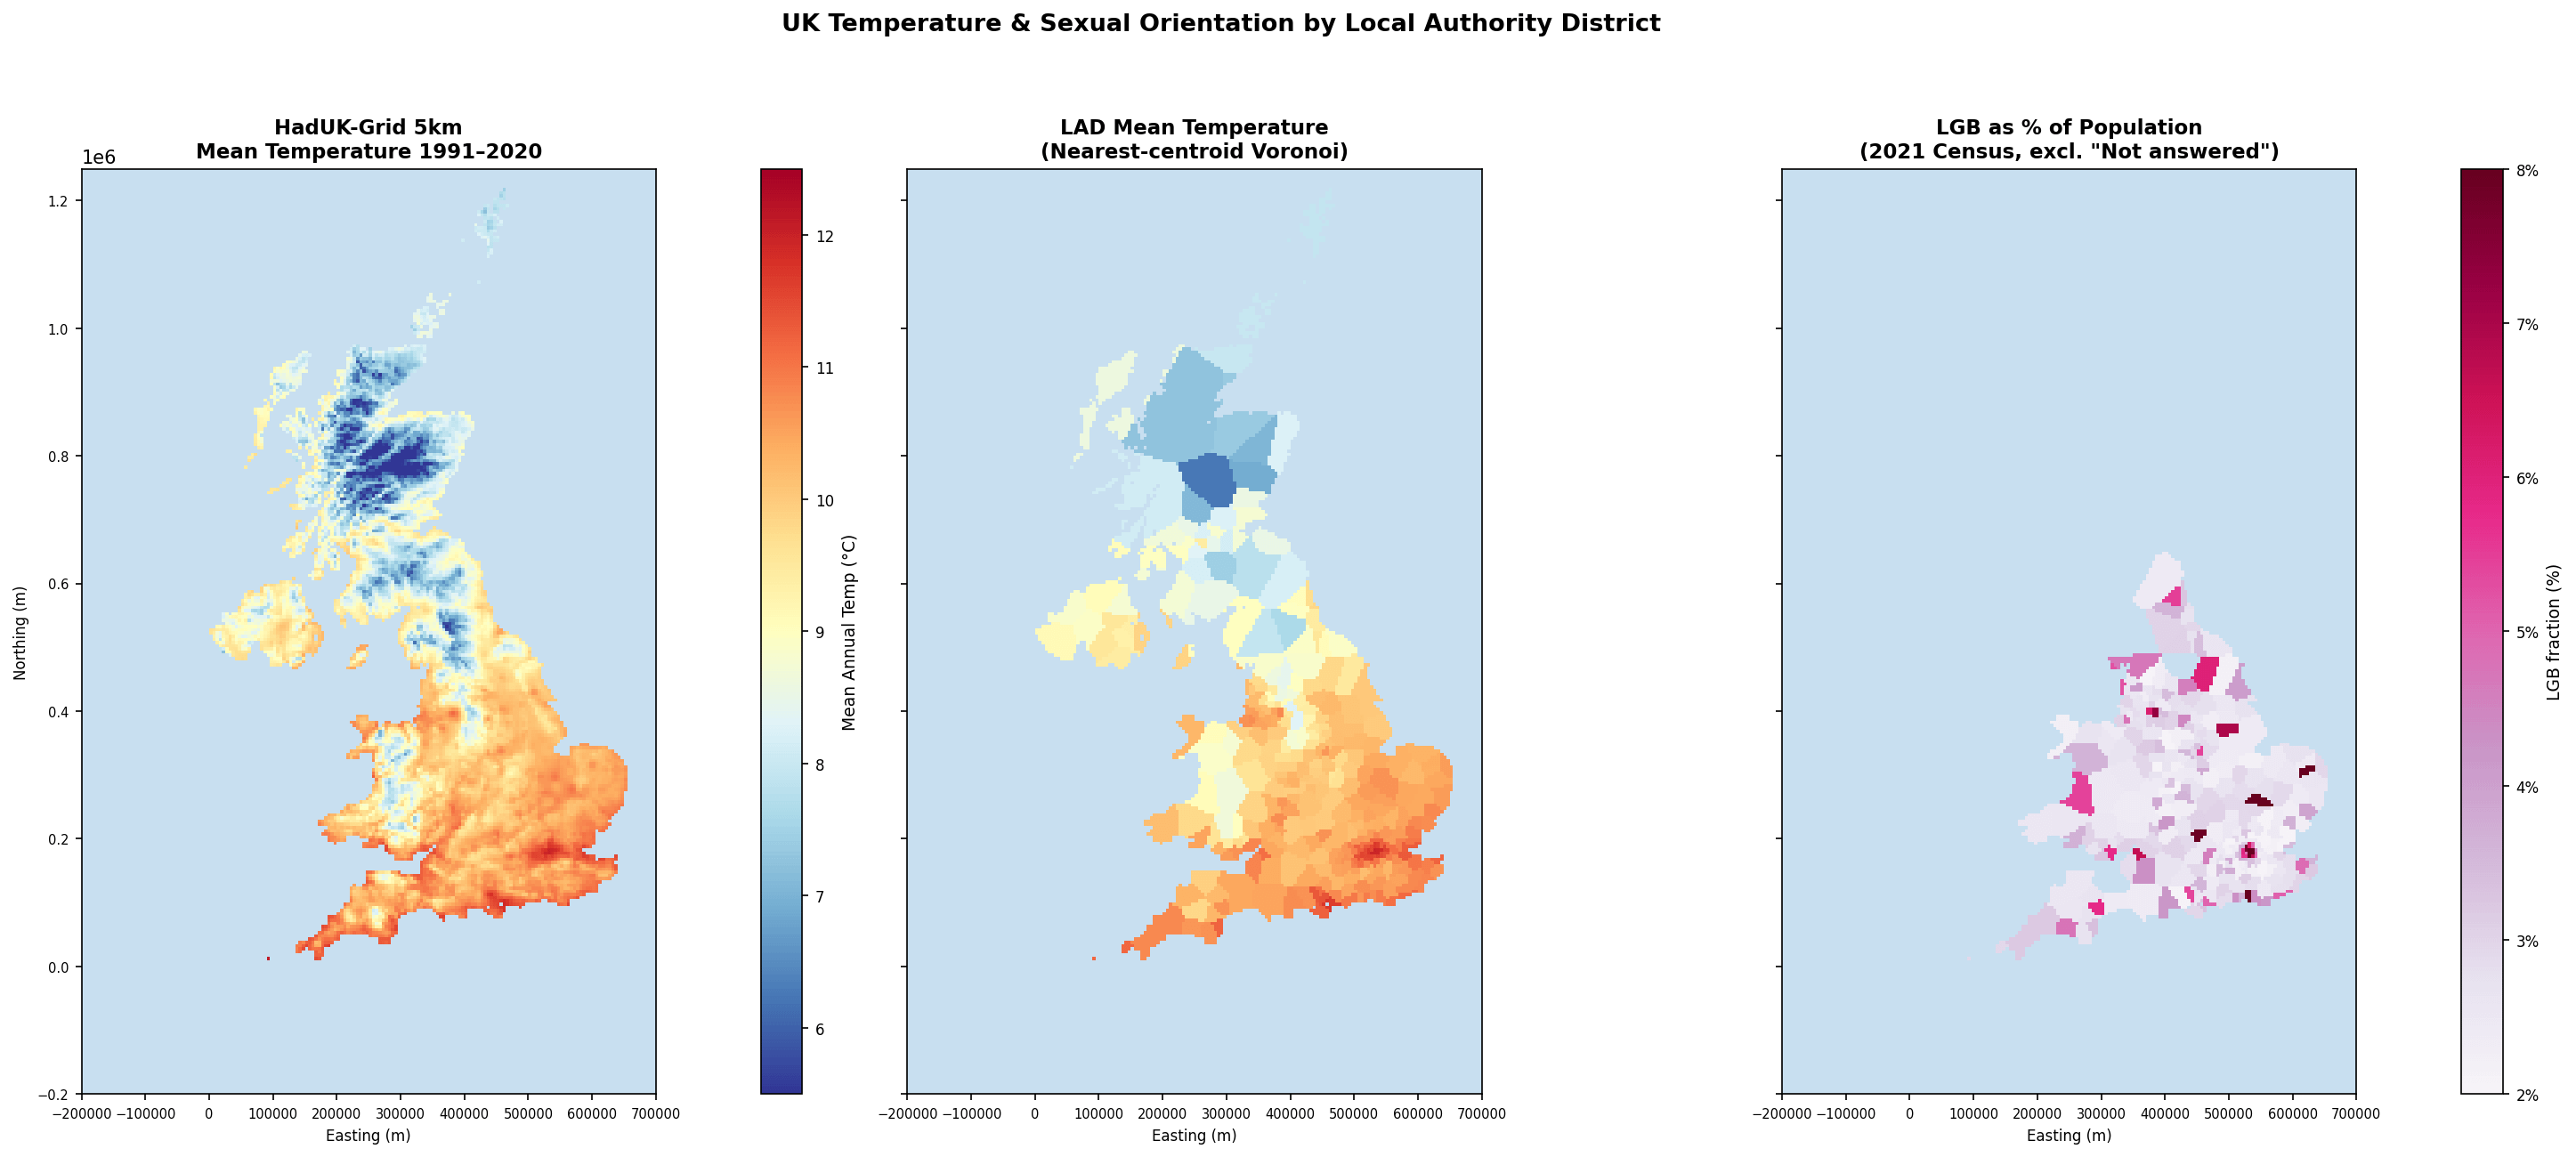
Temperature assignment. Mean annual surface air temperature from the HadUK-Grid 5 km climatology was aggregated to 361 UK LAD boundaries by nearest-centroid (Voronoi) tessellation, assigning each 5 km grid cell to the LAD whose published centroid lay nearest in British National Grid coordinates. LAD mean temperatures ranged from 3.4°C (Highland, Scotland) to 12.1°C (several inner London boroughs), consistent with established north–south and urban–rural gradients (3).
Sexual orientation. Census table TS077 records sexual orientation for 43.1 million England and Wales residents aged 16 and over across 331 LADs. Of these, 41.7 million (96.6%) identified as straight/heterosexual, 1.46 million (3.4%) as LGB (gay or lesbian, bisexual, or another specific orientation), and 2.9 million did not answer. The LGB fraction varies substantially across LADs, from 1.7% in several rural districts to 11.7% in the City of London. High-LGB LADs cluster in inner London, Brighton and Hove, and central Manchester.
LGB individuals live in warmer places. Restricting analysis to the 311 England and Wales LADs with matched temperature estimates, the population-weighted mean annual temperature is 10.45°C for LGB residents (n = 1,462,901) and 10.33°C for straight/heterosexual residents (n = 41,656,347)—a difference of +0.12°C (Table 1). Residents who did not answer the sexual orientation question were excluded from both groups.
Table 1. Population-weighted mean annual temperature by sexual orientation group, England and Wales.
Straight/Heterosexual: 10.33°C (n = 41,656,347)
LGB: 10.45°C (n = 1,462,901)
Difference (LGB − Straight): +0.12°C
Discussion
The +0.12°C thermal differential between LGB and straight populations in England and Wales is consistent with the spatial concentration of sexual minorities in large cities. London is the dominant driver: it accounts for a disproportionate share of the UK LGB population, and its mean annual temperature exceeds the national average by virtue of both its southerly latitude (~51.5°N) and its urban character. Brighton and Hove, the only LAD outside London with an LGB fraction above 8%, is similarly coastal and mild.
A critical caveat concerns the temperature data. HadUK-Grid is produced by interpolating meteorological station observations—many deliberately sited to minimise urban exposure—onto a 5 km regular grid (3). At this resolution, the urban heat island (UHI) effect is largely absent from the gridded product. The UHI in central London is estimated at approximately 4°C relative to the rural surroundings (4), yet this signal does not appear in HadUK-Grid. Because LGB individuals are concentrated in exactly those dense urban environments where the UHI is strongest, our estimate of +0.12°C almost certainly understates the true population-weighted temperature differential. Work is ongoing to obtain the MODIS land surface temperature climatology at 1 km resolution from the Integrated Climate Data Center, University of Hamburg (5), which measures radiant surface temperature directly from satellite and resolves intra-urban thermal gradients.
Two further limitations apply. First, the sexual orientation question in the 2021 Census was not administered in Scotland or Northern Ireland, precluding UK-wide analysis. Second, 20 England and Wales LADs in the census file could not be matched to temperature estimates, likely owing to boundary differences between the 2021 census geography and the May 2024 LAD shapefile; their exclusion is unlikely to bias the result materially.
Materials and Methods
Temperature data. Mean annual surface air temperature was obtained from the HadUK-Grid 5 km resolution 30-year climatology for 1991–2020 (Met Office Hadley Centre, 3). The NetCDF4/HDF5 binary was parsed without third-party geospatial libraries. The zlib-compressed, HDF5-shuffle-filtered data block was located at byte offset 13,689. The inverse shuffle transform for 8-byte (float64) elements was applied prior to decompression. Grid coordinates in British National Grid (OSGB36/EPSG:27700) were recovered from byte offsets 95,167 (180 easting values) and 105,933 (290 northing values), at 5,000 m spacing. Values outside −20 to +25°C were masked.
LAD boundaries and temperature aggregation. Local Authority District boundaries for May 2024 were obtained from the ONS Open Geography Portal. Centroid coordinates were extracted from the accompanying DBF attribute table. Each 5 km grid cell was assigned to the nearest LAD centroid (Voronoi tessellation). LAD mean temperatures were computed as the arithmetic mean of all valid assigned grid cells.
Sexual orientation data. Census table TS077 was obtained from the Office for National Statistics. Respondents classified as gay or lesbian, bisexual, or "all other sexual orientations" were pooled into a single LGB group. Those not answering were excluded from both the LGB fraction and the population-weighted temperature calculation.
Population-weighted temperatures. For each group g ∈ {straight, LGB}, the population-weighted mean temperature was computed as T̄g = Σi Ti nig / Σi nig, where Ti is the mean temperature of LAD i and nig is the population of group g in LAD i, summed over the 311 England and Wales LADs with valid temperature estimates. All computations were performed in Python using NumPy; visualisations were produced with Matplotlib.
References
1. G. Gates, L. Frisch, Where the Gays Are: The Social and Economic Geography of Gay and Lesbian America (Urban Institute Press, 2003).
2. G. Brown, Scalar politics, the metropolitan glance and the construction of gender and sexuality in British cities. Environ. Plan. A 40, 942–960 (2008).
3. M. R. Hollis et al., HadUK-Grid—A new UK dataset of gridded climate observations. Geosci. Data J. 6, 151–159 (2019).
4. C. S. B. Grimmond, T. R. Oke, Heat storage in urban areas. J. Appl. Meteorol. 38, 922–940 (1999).
5. Integrated Climate Data Center, University of Hamburg, MODIS Land Surface Temperature Climatology (2024). https://www.cen.uni-hamburg.de/en/icdc/data/land/modis-lst-annualcycle.html
PS This is my fourth attempt at vibe-coding. Claude is an energetic and skilled research assistant, but rushes in without planning and has poor critical facilities. The first three attempts were failures: Replicating a paper with a non-standard estimator failed, as did attempts to create polygons of countries between 1946 and 2025 and the Roman Empire in 177CE. This was a simpler task. Use existing polygons to compute area temperatures from a grid; compute a weighted average for the two countries; write it up as Science paper; and publish on Substack.
Well that’s one sure way to make sure your study draws fire. 😉
Kudos for your contribution (we guess you were a last minute addition) on Andy’s pod last week on RCP8.5/SSP5-8.5 (and SSP3-7.0) being set aside as implausible. The ridiculous 6X global coal consumption aside, the “BAU” descriptor adopted by IPCC and the legacy media, those high emissions scenarios were going to be wrong based on global birth rate trends since 2010. Clearly.